In this project, we developed a model for activity recognition using sequential sensory data. The dataset used for this project includes body motion and vital signs recordings for ten volunteers performing various physical activities. The data was collected using wearable sensors placed on the chest, right wrist, and left ankle of the subjects.
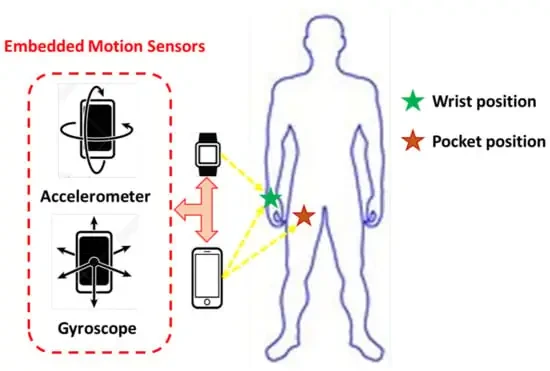
Figure 1. Activity signal acquisition from handheld smart devices.
#Dataset
The dataset comprises recordings of 12 physical activities, including standing still, sitting, lying down, walking, climbing stairs, waist bends, arm elevation, knee bends, cycling, jogging, running, and jumping. The data is stored in log files, with each file containing samples recorded for all sensors.
#Data Columns
- Acceleration from the chest sensor (X, Y, Z axes)
- Electrocardiogram signal (lead 1 and lead 2)
- Acceleration from the left-ankle sensor (X, Y, Z axes)
- Gyro from the left-ankle sensor (X, Y, Z axes)
- Magnetometer from the left-ankle sensor (X, Y, Z axes)
- Acceleration from the right-lower-arm sensor (X, Y, Z axes)
- Gyro from the right-lower-arm sensor (X, Y, Z axes)
- Magnetometer from the right-lower-arm sensor (X, Y, Z axes)
- Label (activity identifier)
#Model Pipeline
#1. Parameterization
We defined several constants for the project, including the class dictionary, sample rate, overlap block size, overlap ratio, sequence length, and the number of features for each domain.
DATA_CLASS_DICTIONARY = ["None", "Standing", "Sitting", "Lying", "Walking", "Climbing stairs", "Waist bending", "Arm elevation", "Knees bending", "Cycling", "Jogging", "Running", "Jumping"]
DATA_SAMPLE_RATE = 50
DATA_OVERLAP_BLOCKSIZE = 250
DATA_OVERLAP_RATIO = 0.5
DATA_SEQUENCE_LENGTH = 12
DATA_MODEL_NUM_FEATURES_ACC_TEMPSTAT = 27
DATA_MODEL_NUM_FEATURES_ACC_SPECT = 25
DATA_MODEL_NUM_FEATURES_ECG = 6
#2. Download, Extract, and Load Data
We downloaded and extracted the dataset from the UCI Machine Learning Repository. The data was then loaded into pandas dataframes for further processing.
if not os.path.exists('./data'):
    download_and_extract('data')
for i in range(1, 11):
    data_file = f'data/mHealth_subject{i}.log'
    data_dataframes[i] = read_dataset(file_path=data_file, type='log')
    print(f'{data_file}:', data_dataframes[i].values.shape)
#3. Preprocessing Data
We removed data entries with null or unused labels and upsampled the electrocardiogram signal to meet the required sample rate for processing.
signal_new = scipy.signal.resample(signal, len(signal) * 2)
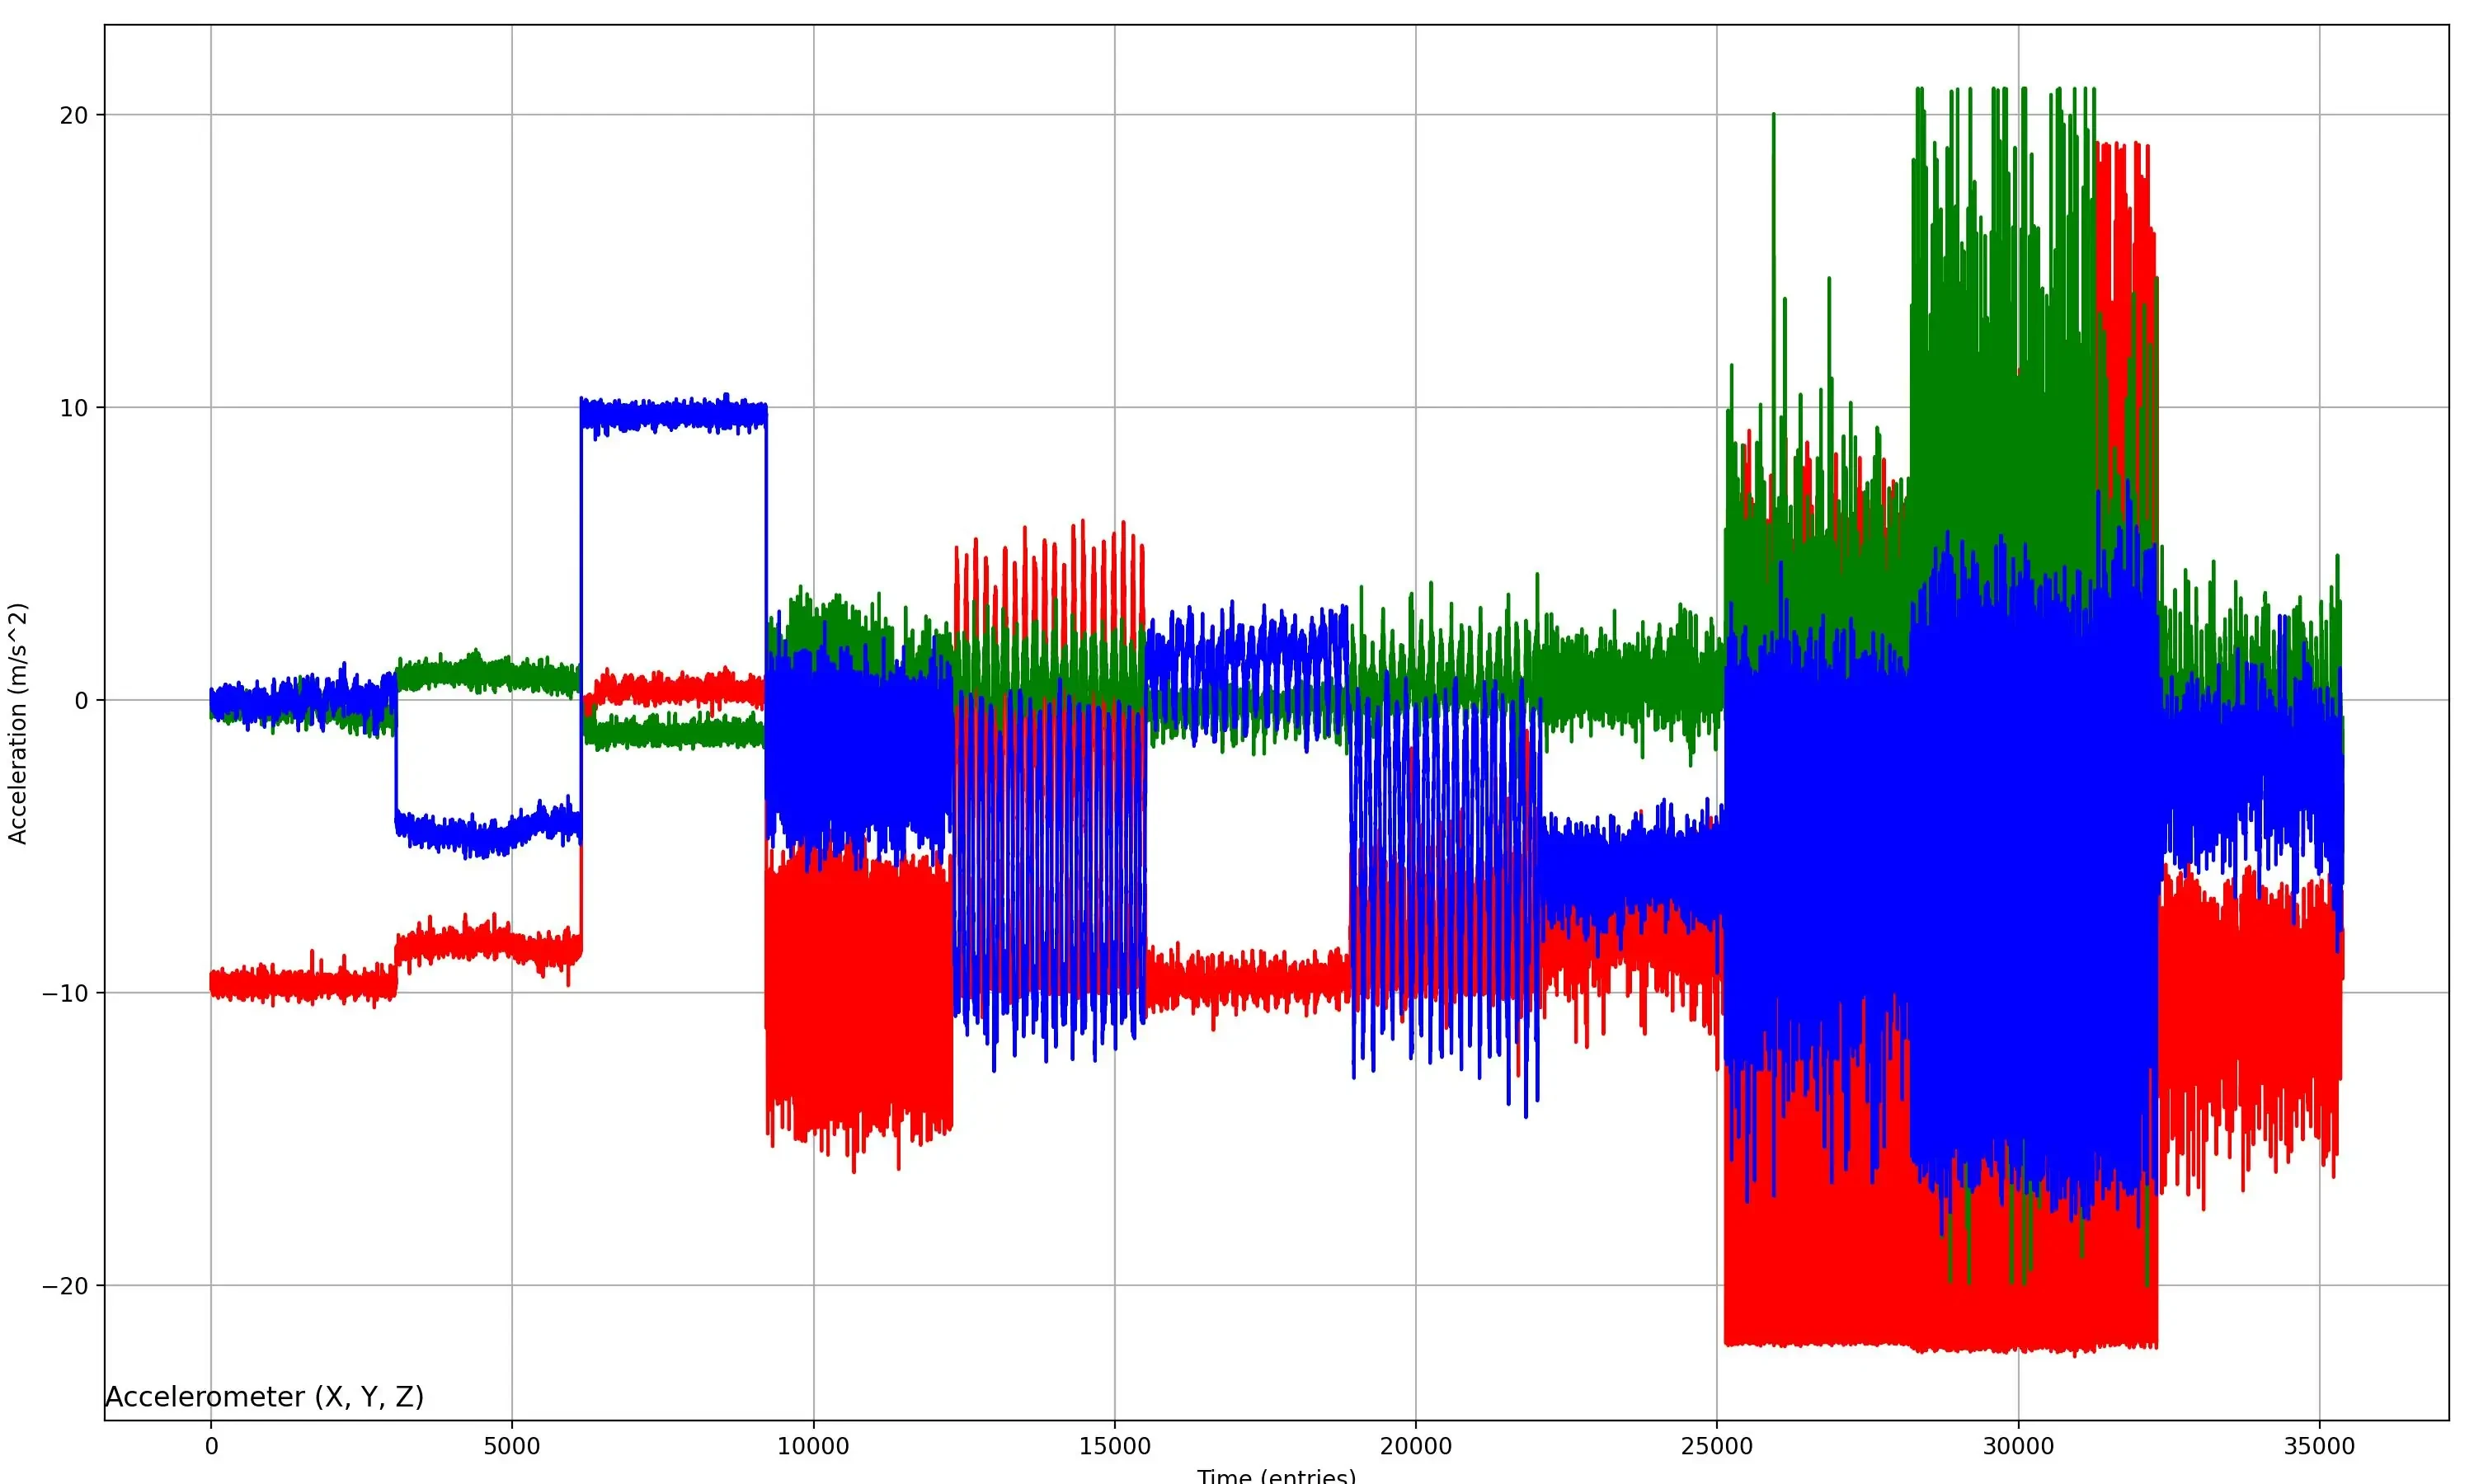
Figure 2. Extracted and pre-processed data.
#4. Extract Features Using Overlapping Sliding Window Method
We used an overlapping sliding window method to extract features from the data. The features were extracted for each window of data.
for i in range(1, 11):
    data = data_dataframes[i]
    X_windows = window_splitter(data, DATA_OVERLAP_BLOCKSIZE, DATA_OVERLAP_RATIO)
    for X_window in X_windows:
        X_window_features = extract_features(X_window, DATA_SAMPLE_RATE)
#5. Split Test and Train Data
We split the data into training and testing sets using stratified K-Folds cross-validation.
X_train, X_test, y_train, y_test = train_test_split(X, y, train_size=0.75, stratify=y)
#6. Fit Model with Train Data
We trained the model using the training data and evaluated its performance on the test data.
data_model.fit(X_train, y_train)
#7. Normalize Data and Print Best Classifier Score
We normalized the test data and printed the best classifier score.
X_test = data_model.normalize(X_test)
print('Test score:', data_model.score(X_test, y_test))
#8. Save Model as a Binary File
We saved the trained model as a binary file for future use.
data_model.save_model()
#Results
The model achieved high accuracy in recognizing the activities from the sensory data. The results were visualized using various plots, including time-domain and power spectral density (PSD) plots.
#Conclusion
This project demonstrates the effectiveness of using sequential sensory data for activity recognition. The model pipeline, from data preprocessing to feature extraction and model training, provides a comprehensive approach to building an accurate activity recognition system. The results show that the model can successfully recognize various activities with high accuracy.
#References
- CNG-562-project (opens in a new tab)
- How to Model Human Activity From Smartphone Data (opens in a new tab)
- Evaluate Machine Learning Algorithms for Human Activity Recognition (opens in a new tab)
- Exploring Heart Rate Variability using Python (opens in a new tab)
- Power spectral density of real accelerometer data shows outlier at 0 Hz (opens in a new tab)
- Difference between scipy periodogram and self implemented power spectral density (opens in a new tab)
- Plot the power spectral density using Matplotlib – Python (opens in a new tab)
- Plotting power spectrum in python (opens in a new tab)
- How to do Histogram Equalization based on audio frequency? (opens in a new tab)
Similar code found with 1 license type